Kevin Munson
Just a human doing human things
I am interested in cyber security, security analytics, intelligence, and plants.
View My LinkedIn Profile
COVID and Policy implementations
Our team examined the COVID data that is put out by the WHO and Cornell as well the polciy information for each country to see two things:
1. What is driving COVID cases?
Machine learning is valuable because it allows you to understand which features are important in a dataset. From this, questions then can be formulated to ask the dataset in order to get answers that can be turned into data visualizations.
All the answers are in the data but it is hard to know which questions are the best and right questions to be asking the dataset. Our random forrest pointed to closing public transportation, international travel restrictions, and testing policy.
2. Are policies from the government making a difference?
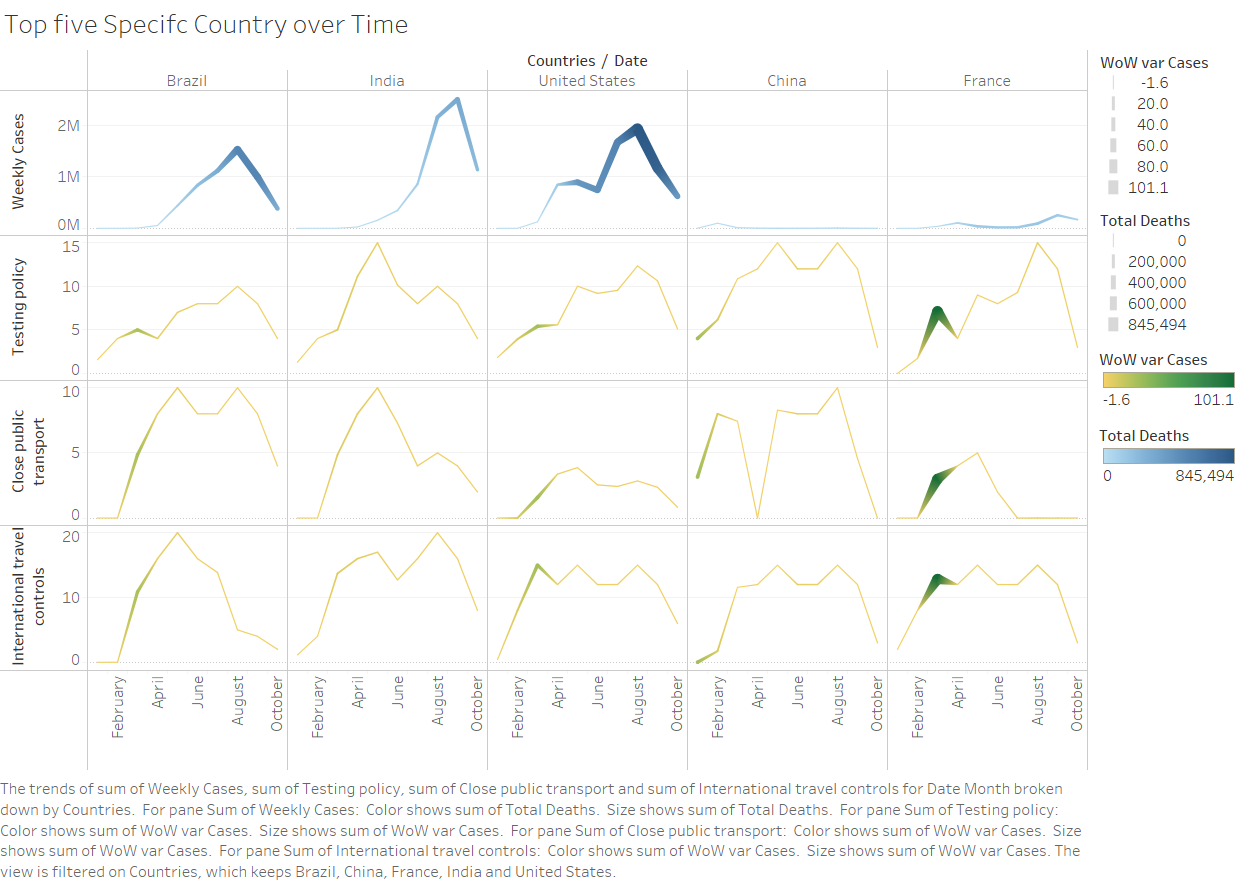
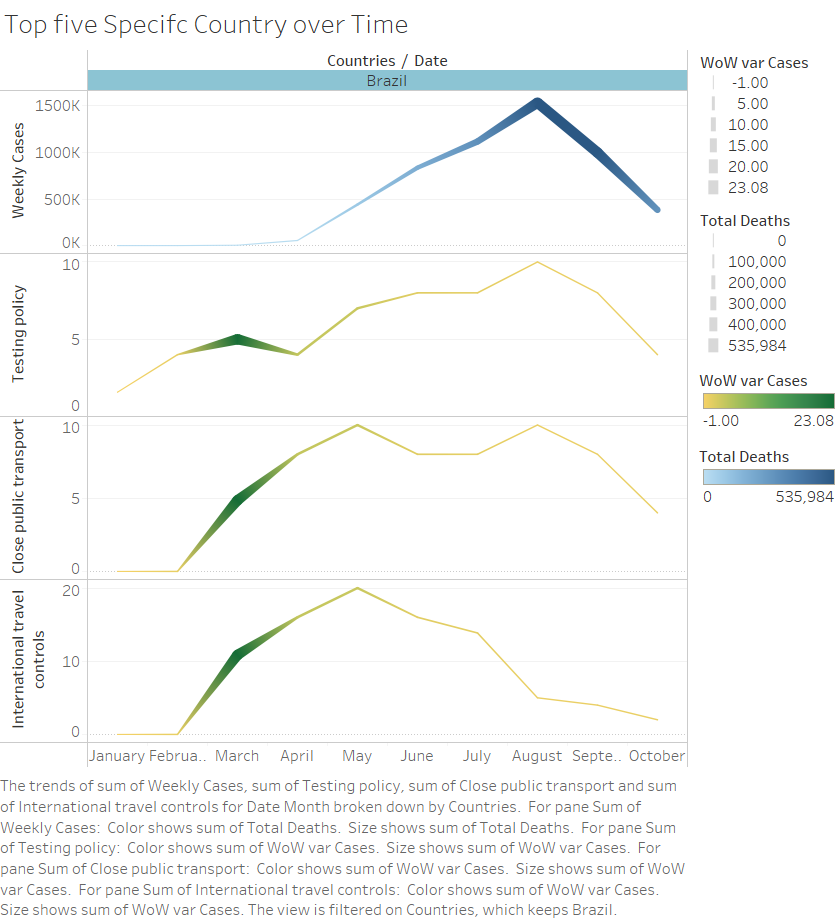
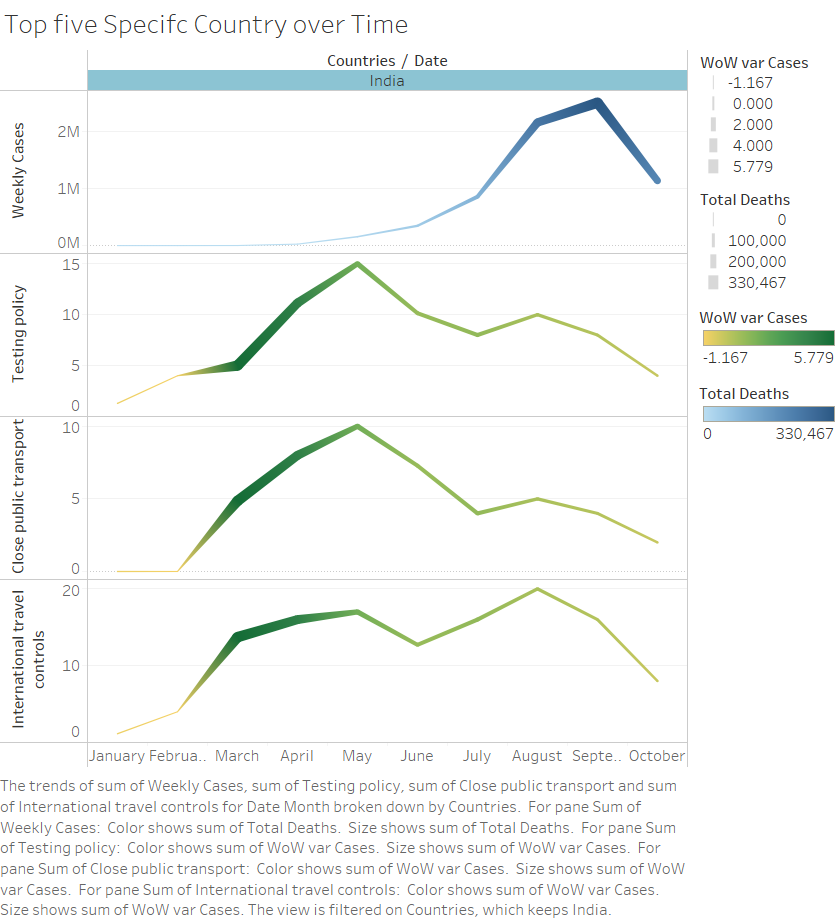
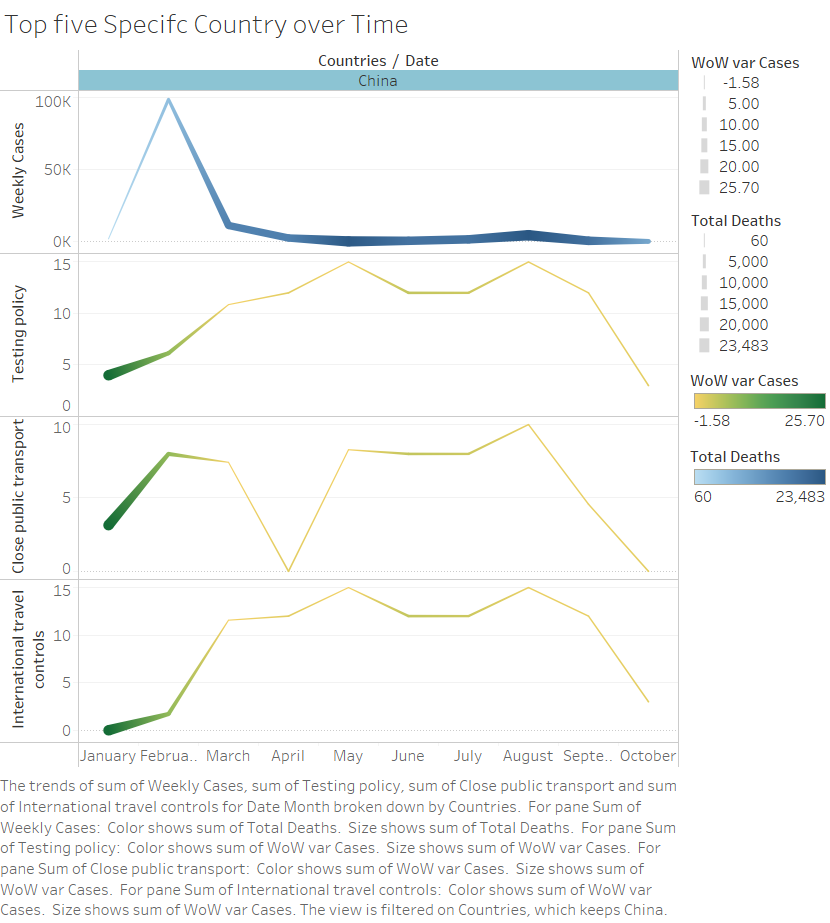
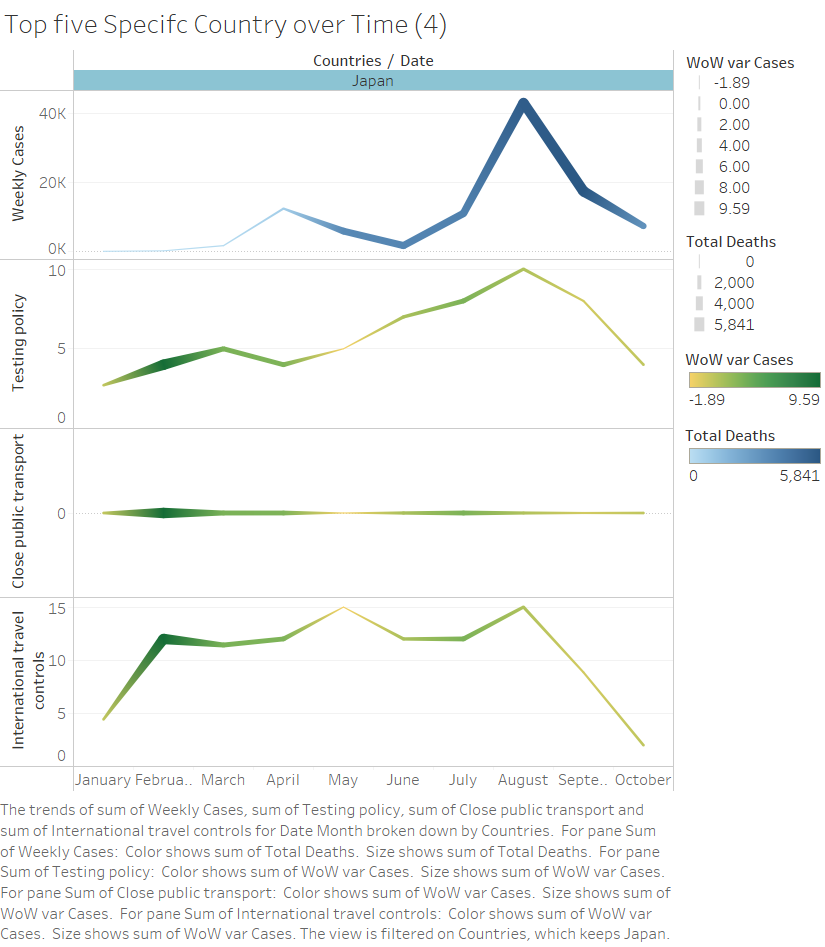
This is the top three countries in terms of cases which are Brazil, the US, and India. China and France are in there as well for scale.
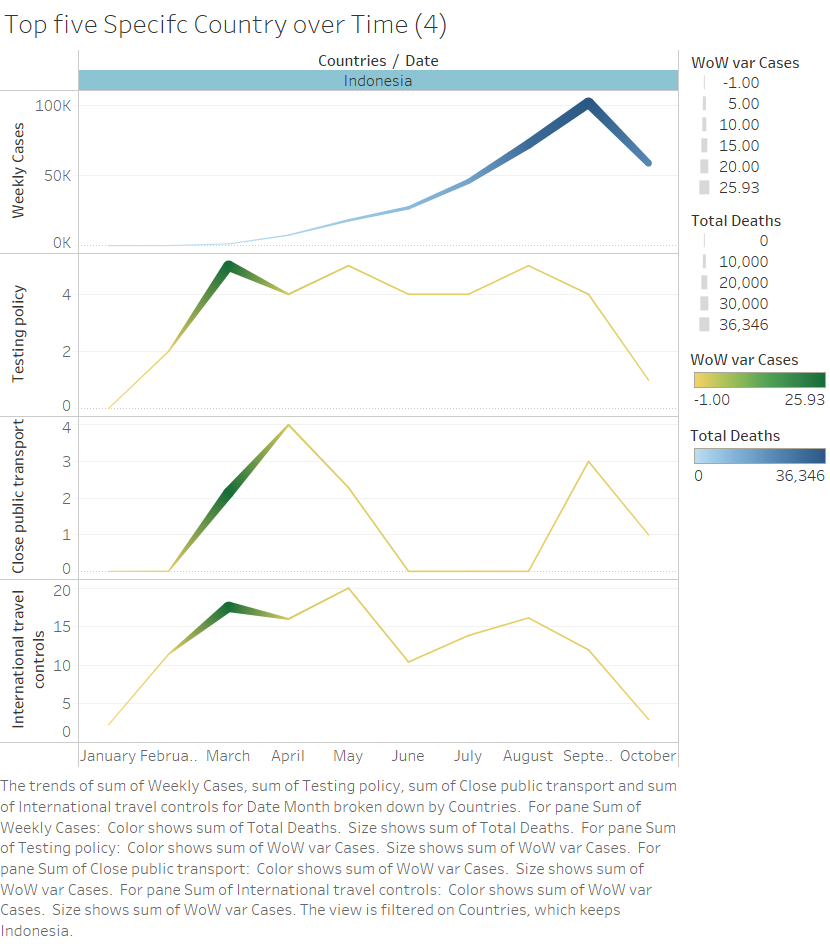
The top line is weekly cases and the blue is the number of deaths. Each of those are sums for the months. The other lines are the level of the policy and the color on these lines shows the weekyly variance in cases. It is often the case that as cases and variance increase, there is a change in policy that then shows cases responding to the policies. The really interesting cases are Japan where public transportation never stopped.
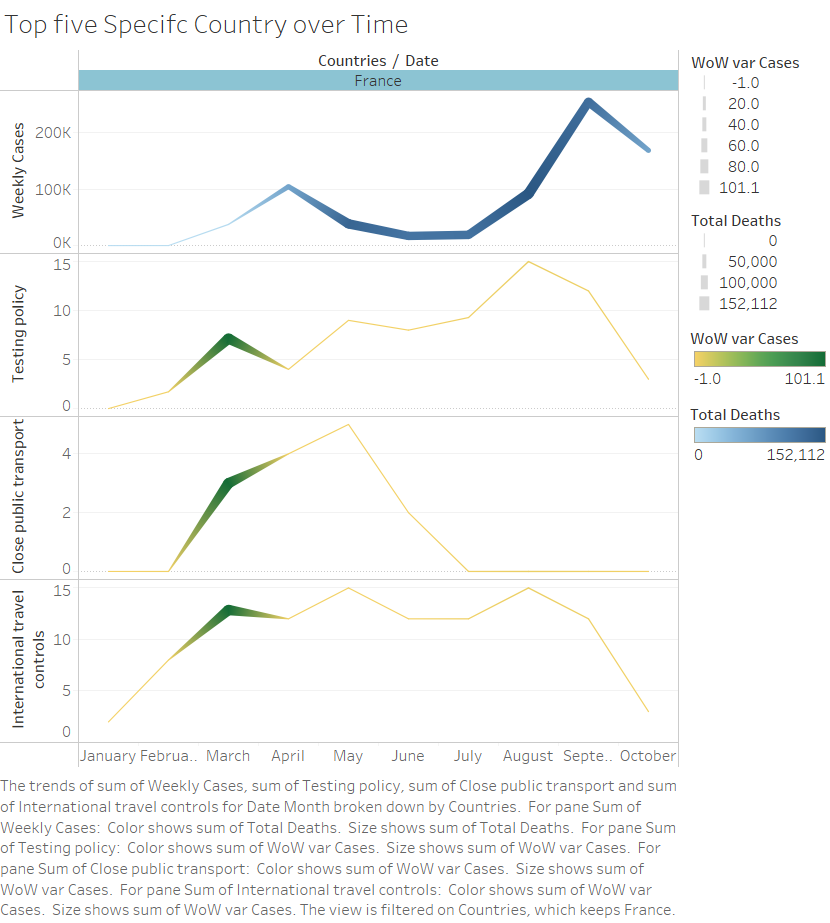
Now for some individual countries to really see the effects. First we have France.
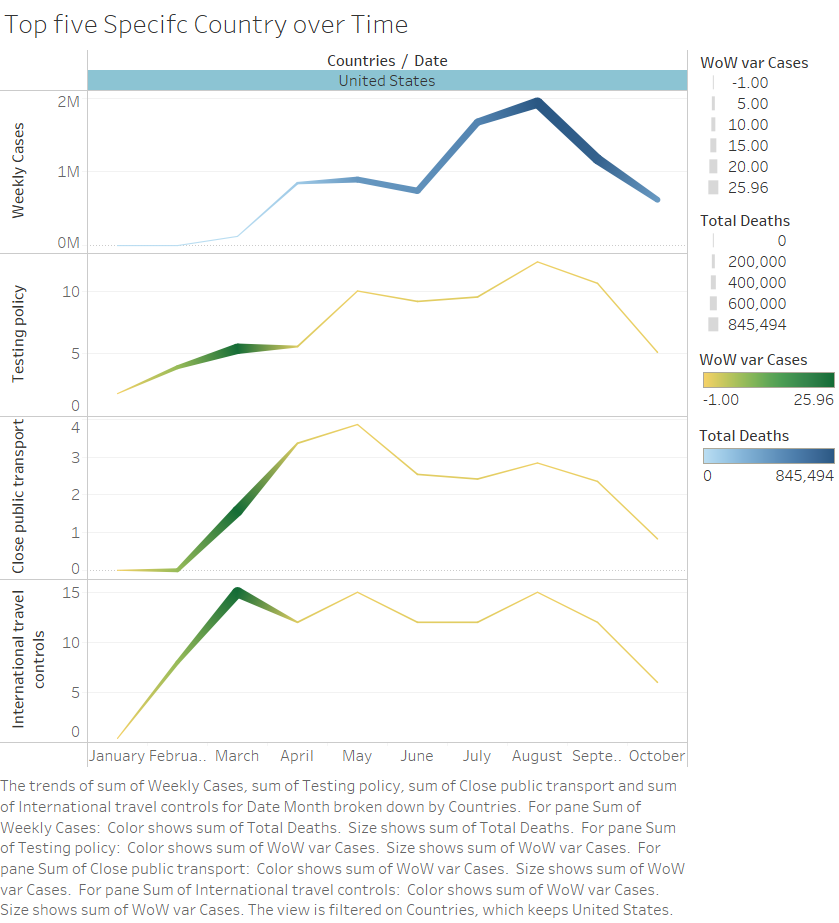
The United States
Brazil
India
China
Indonesia
Japan
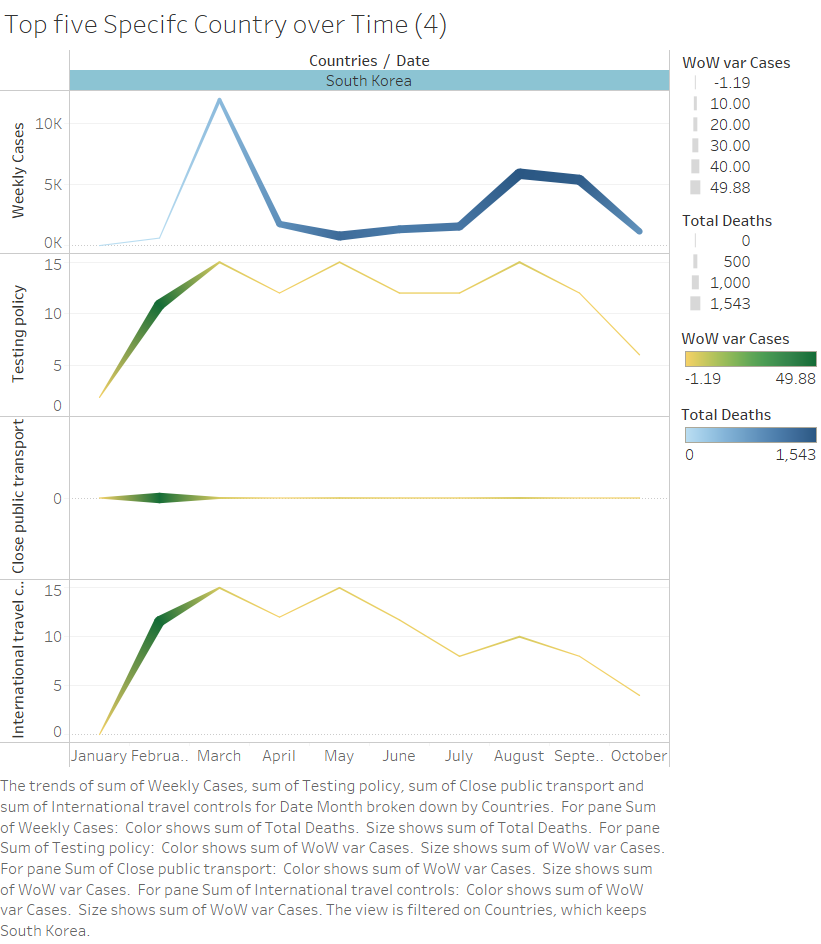
South Korea